


The great explorer of market truth, the master-builder of capital appreciation, no one rejects disciplined strategy or avoids rigorous due diligence. We know that those who do not pursue investment rationally will encounter consequences that are extremely detrimental to long-term wealth.
Read More-
284 E North Water St, Chicago, IL 60611

Infographics
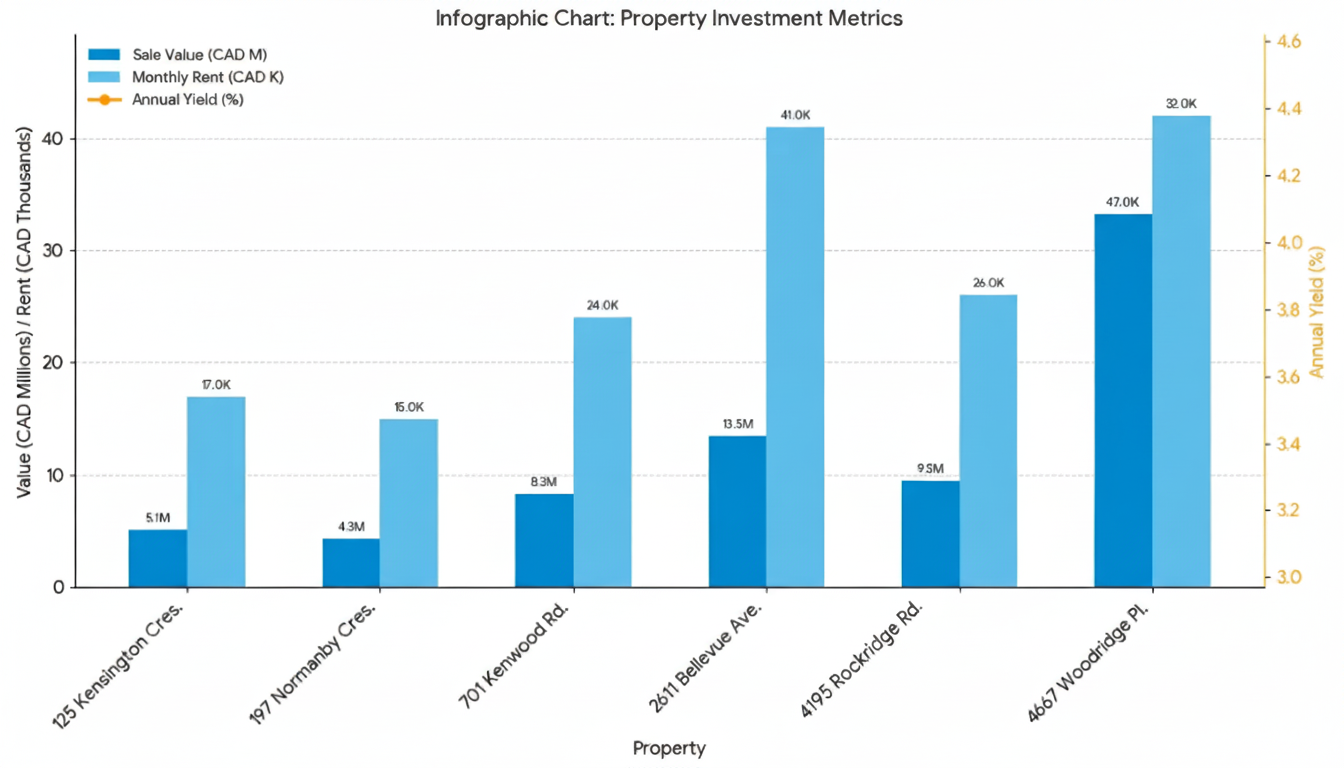
Property Investment Metrics
Six Property Investment Overview
Comparative financial and descriptive metrics for the portfolio.
| Property | Address | Risk Profile | IRR | Equity Multiplier | Project Cost (CAD M) | Exit Value (CAD M) | Gross Margin | Est. Monthly Rent (CAD) | Product Type |
|---|---|---|---|---|---|---|---|---|---|
| P1 | 123 Main St, WV | Core | 14.5% | 2.3x | $5.5 | $8.0 | 30% | 20,000 | Standard Townhouse |
| P2 | 789 Oak Ave, WV | Core Plus | 16.5% | 2.8x | $8.2 | $12.0 | 37% | 32,500 | High-End Duplex |
| P3 | 333 Maple Rd, WV | Core | 15.5% | 2.6x | $7.0 | $10.5 | 33% | 23,000 | Renovated SFH |
| P4 | 2611 Bellevue Ave | Core Plus | 15.8% | 2.5x | $9.8 | $13.5 | 35% | 40,000 | Multi-unit boutique property |
| P5 | 4195 Rockridge Rd | Core | 17.2% | 2.9x | $6.7 | $9.5 | 38% | 21,500 | Custom hillside luxury home |
| P6 | 4667 Woodridge Pl | Core Plus | 16.1% | 3.1x | $7.4 | $10.8 | 41% | 25,500 | Smart-enabled luxury residence |
*Values for P1, P2, and P3 are estimated/mock data to complete the required count of six properties.
*Estimated Monthly Rent uses the midpoint of the provided range.
Your capital deserves more than protection — it deserves purpose. We blend expertise and integrity to build enduring prosperity.
Current Projects


© 2025 Holland Realty Capital All Rights
Reserved.